Introduction and clinical motivation
Lung cancer remains the leading cause of cancer-related mortality worldwide. Despite substantial advancements in disease management, the five-year relative survival rate for late stage lung cancer remains below 10%1. In contrast, patients diagnosed at early pathological stages IA1, IA2, and IA3 have cure rates exceeding 80%, and in some cases, reaching over 90%2,3. These statistics underscore the critical importance of early detection in reducing the burden of lung cancer.
In the early 1990s, computed tomography (CT) was proposed as a method for early lung cancer detection due to its ability to detect and characterize small solitary pulmonary nodules4. Since then, CT has revolutionized lung cancer detection and diagnosis. In 2021 alone, 866,954 lung screening CT exams were performed in the United States by facilities participating in the ACR Lung Cancer Screening Registry5. The growing recognition of CT’s benefits in reducing lung cancer mortality through earlier detection, along with the expansion of screening guidelines, is likely to drive the broader adoption of low-dose CT (LDCT) across health systems worldwide.
Pulmonary nodule detection has become a relatively straightforward task, thanks to advancements in imaging resolution and software tools. For decades, CT scanners with advanced image processing capabilities have provided thinner slice thickness and highly detailed cross-sectional data, enabling even small nodules to be easily identified by radiologists or automated detection algorithms6. However, one of the greatest challenges lies not in detection itself but in accurately characterizing nodules and determining their clinical significance, which typically requires careful analysis and, in a substantial number of cases, further diagnostic follow-up.
“Detecting a pulmonary nodule is a crucial first step leading towards early diagnosis of lung cancer, but it is only the beginning. The main complexity lies in identifying clinically significant malignant lesions and differentiating them from benign findings.” David Yankelevitz – Professor of Radiology, Icahn School of Medicine at Mount Sinai.
The need for accurate lung nodule classification has prompted imaging to focus on one key consideration: cancerous nodules are believed to grow exponentially, with their volume increasing at a consistent proportional rate over time and within boundaries defined as being typical for malignancy. Since this is not the case for benign nodules, changes in volume become a simple yet reliable differentiator. Consequently, volume doubling time (VDT) has emerged as a valuable metric for assessing the malignancy probability of pulmonary nodules. This characteristic growth pattern enables VDT to serve as a distinguishing feature: malignant nodules typically exhibit shorter VDTs compared to benign ones. Numerous studies have highlighted how the measurement of volumetric growth enhances the ability to differentiate between benign and malignant nodules7. By tracking changes in nodule size over time and calculating VDT, clinicians gain a more reliable method to predict malignancy, supporting more informed decision-making about the need for further diagnostics or therapeutic interventions.
There are multiple frameworks designed for the management and follow-up of pulmonary nodules detected during imaging. All guidelines aim to improve early lung cancer detection and are intended to streamline clinical decision-making, minimize unnecessary interventions, and ensure the timely identification of potentially malignant nodules.
Some, such as the British Thoracic Society (BTS) Guidelines8, the European Position Statement on Lung Cancer Screening9, the Japanese Lung Cancer Screening Guidelines10, and the Fleischner Society Guidelines (widely adopted for the management of incidentally detected pulmonary nodules)11, incorporate volume doubling time (VDT) as a central component and key factor for lung nodule risk stratification. Others, such as Lung RADS12, the NCCN Guidelines13, the Canadian Association of Radiologists (CAR) Guidelines14, and the National Health Commission of China Guidelines15, rely more on simpler size-based criteria and categorical probability stratification. Nevertheless, these approaches still leave VDT for secondary or advanced assessments, as volume doubling time is certainly not the only, but a valuable, rather simple, and reliable characteristic, used for evaluation of lung nodule’s clinical significance.
Despite their differences, all of these and similar standards provide evidence-based recommendations for follow-up intervals as well as management strategies by considering nodule size, growth patterns, and patient or participant risk factors, and aiming for reducing variability in the interpretation.
Importance of measurement precision
Precision in diagnosing lung cancer when tumors are still small, particularly at sizes as small as 5-6 mm, is paramount for improving patient outcomes16. At these dimensions, even a minor absolute increase in diameter can signify a substantial rise in probability of malignancy. Highlighting the exponential nature of volumetric progression, a pulmonary nodule measuring 6 mm doubles in volume by the time it grows to just 7.6 mm. Since volume doubling time is a critical metric for assessing malignancy risk, precise measurement of nodule size becomes essential for early and reliable risk stratification. Without such precision, clinicians risk underestimating or overestimating malignancy probability, potentially delaying timely interventions or causing unnecessary alarm and additional service line workflow burden.
So, in the context of pulmonary nodule size and volume assessment, a CT scanner functions as a measurement device, where the precision of data directly influences clinical decision-making. As early lung cancer detection hinges on accurately identifying and tracking even small changes in nodule size, ensuring quality, consistency, and accuracy of CT data acquisition is critical17.
The accuracy and consistency of CT data throughout the pulmonary nodule workup are crucial. Precise size determination at the initial detection is essential for proper adherence to Lung-RADS protocols, where follow-up intervals depend on nodule dimensions [12]. While, accuracy is particularly important for establishing a reliable baseline, if the initial measurements are inaccurate, subsequent evaluations may also fail to identify clinically significant growth (or falsely identify it), potentially delaying the diagnosis. Furthermore, if follow-up CT imaging is prone to errors, increases in the volume of smaller pulmonary nodules may be missed.
Additionally, this importance is amplified by the mathematical relationship between diameter and volume in spherical models, which are often used to approximate nodule shape. A relatively modest error of 12–15% in diameter measurement can translate into a disproportionately large error of 40–52% in estimated volume, due to the cubic relationship between diameter and volume. Such variability can significantly impact the assessment of nodule growth, potentially leading to misclassification of risk, inappropriate follow-up intervals, or delayed diagnosis18.
Figure 1 illustrates a speculative experiment involving an initially detected pulmonary nodule measuring 6 mm in size (~113 mm³ in volume – for a selected real-world clinical case with round-shaped nodule on the first CT image, shown with yellow arrow). The black solid curve and accompanying dot points represent an estimated ground-truth growth pattern of a solid nodule, based on literature suggestions19. The steeper the curve, or the faster the increase in nodule volume (vertical axis) over time (horizontal axis), the greater the probability of malignancy.
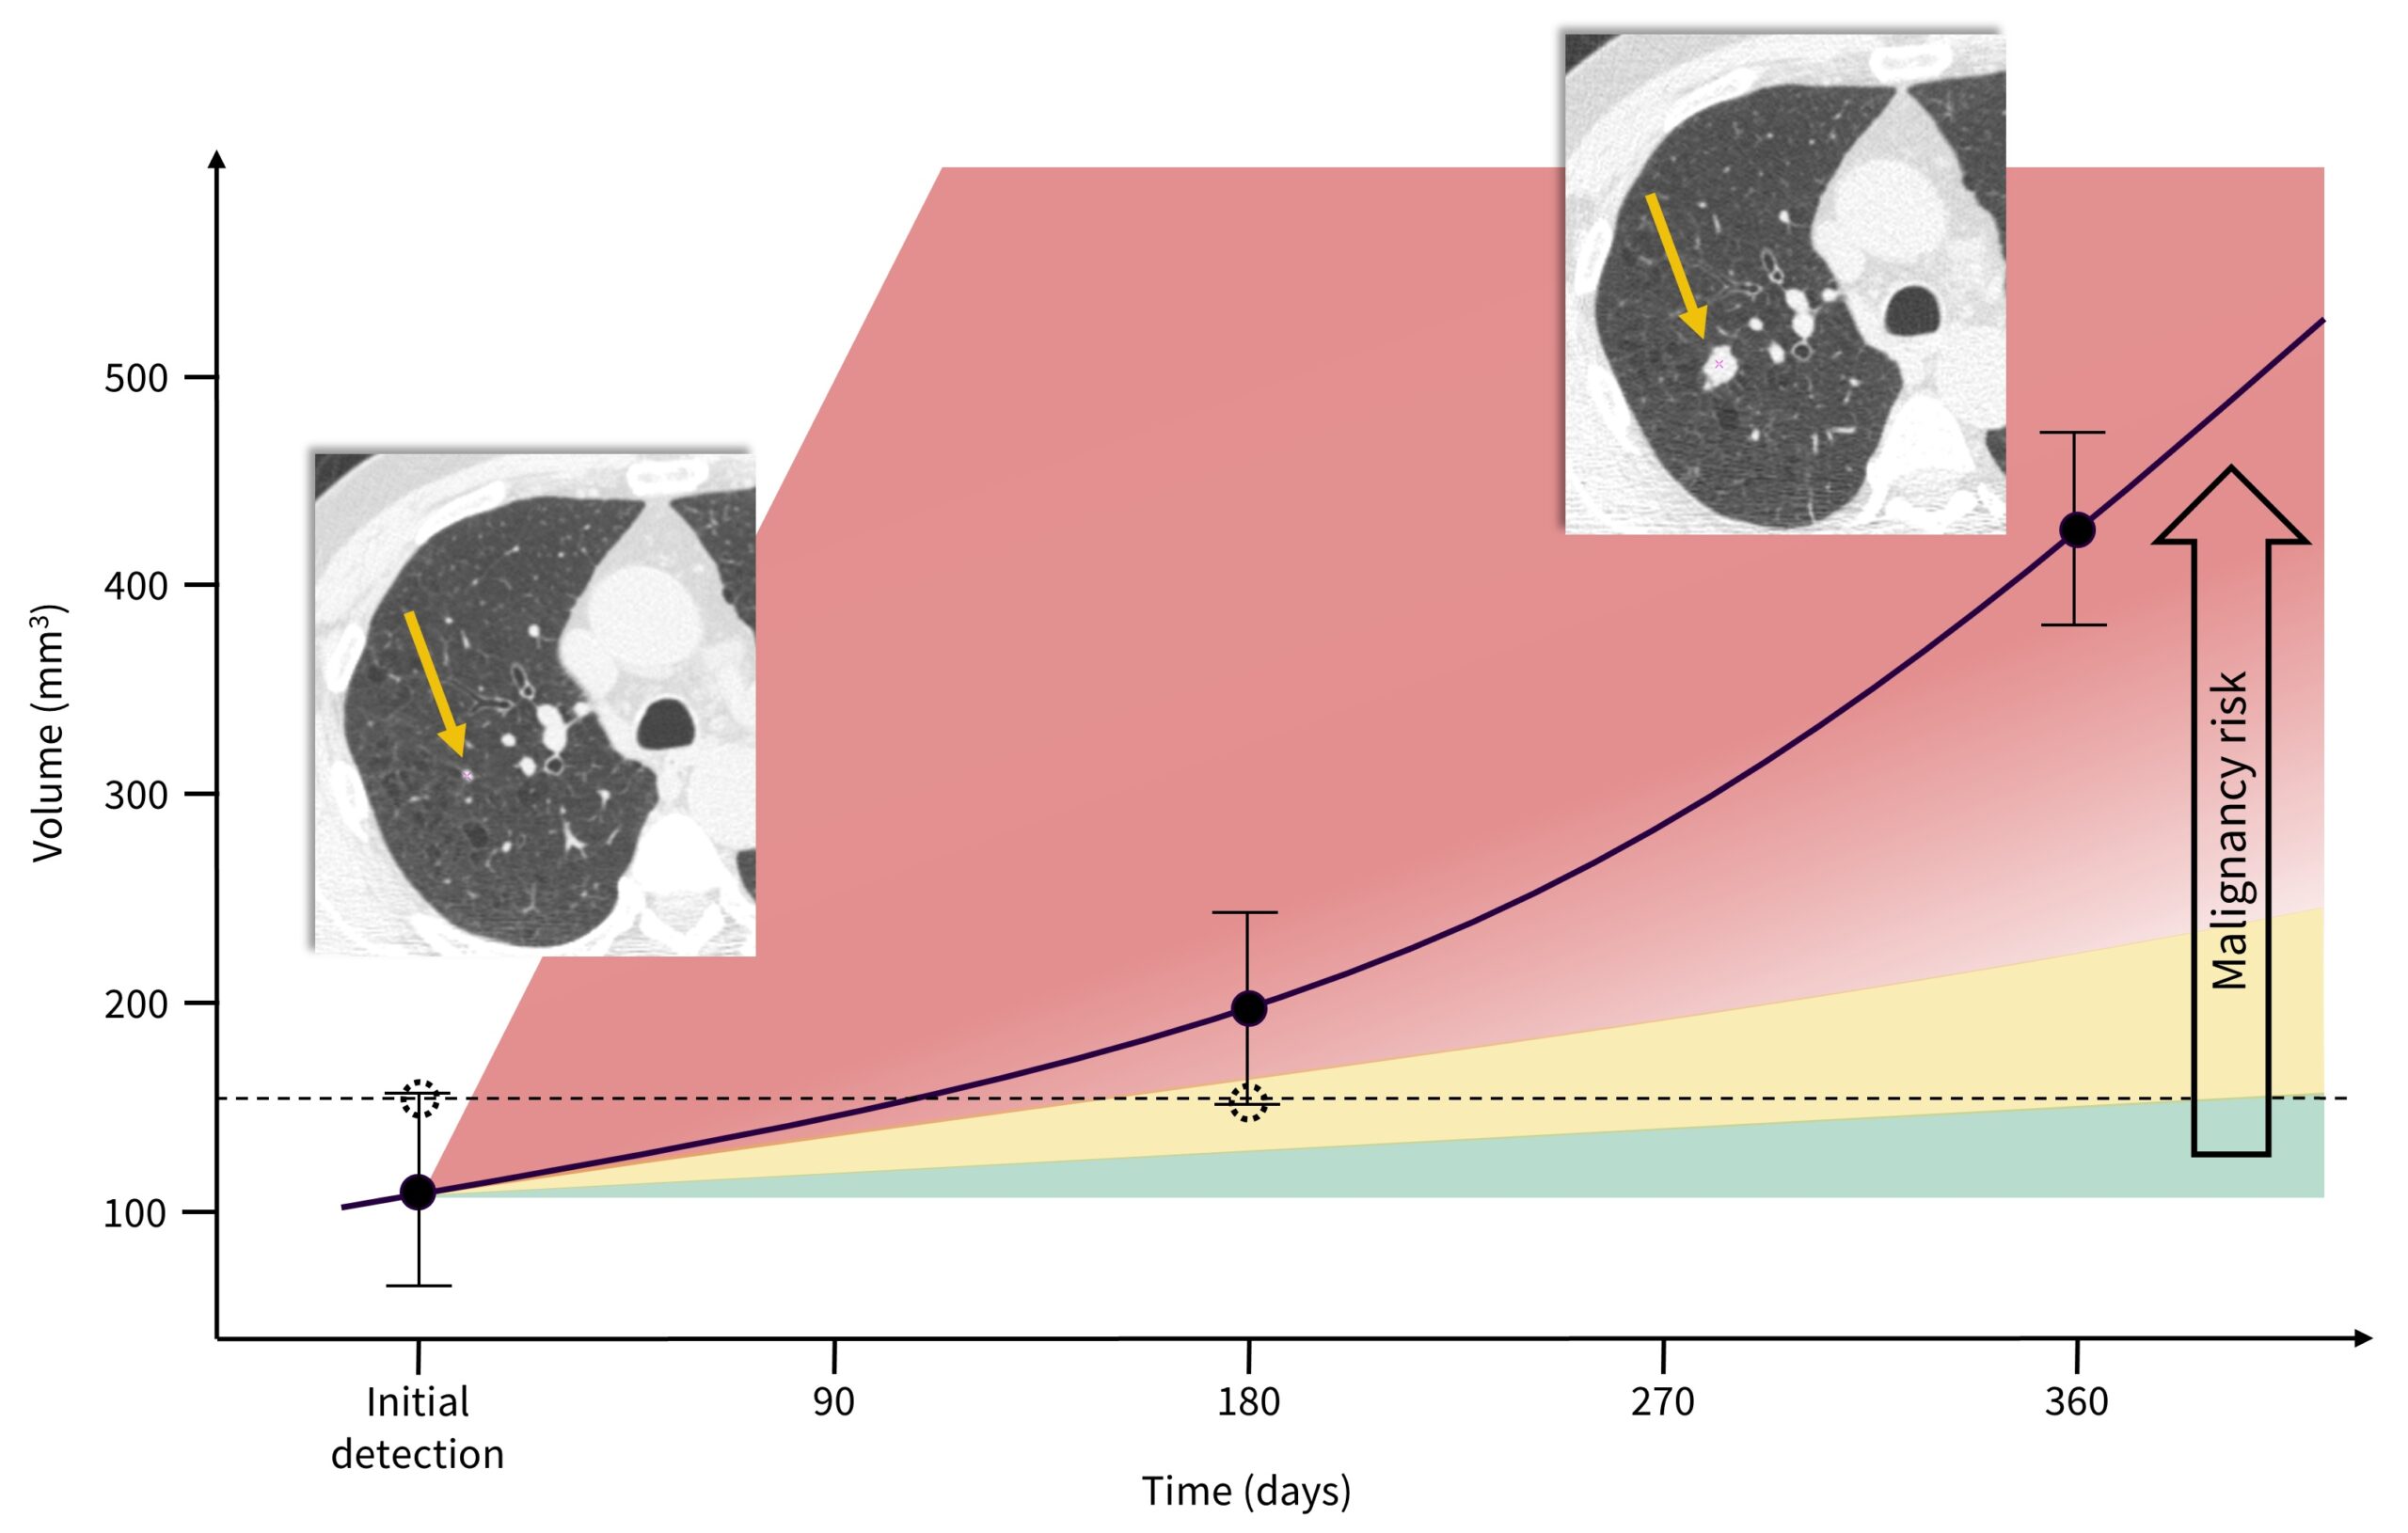
In alignment with the widely accepted VDT cutoff of 400 days for differentiating malignant from benign lesions20, the reported mean VDT for solid lung cancers, approximately 207 days21, is chosen as a reference. Speculative measurement error bars are exaggerated to demonstrate uncertainty in nodule size measurements and their impact on volume determination.
The dotted line and associated dot points represent a hypothetical scenario where the nodule size is initially overestimated, which may result in a shorter follow-up interval of 6 months (Lung-RADS: ≥6 to <8 mm [≥113 to <268 mm³] at baseline) versus 12 months (Lung-RADS: <6 mm [<113 mm³] at baseline). In this hypothetical scenario, the nodule is then underestimated after 180 days, suggesting minimal nodule growth, and ultimately failing to properly characterize the nodule’s growth pattern through its size or volume at initial detection and after 180 days, thus missing the opportunity to determine its malignancy.
The 2nd CT image of the same patient at the 12-month follow-up illustrates potentially missed chance for earlier lung cancer detection, and thereby worsened clinical outcomes. With the second yellow arrow is pointing at a substantially increased nodule size, this theoretical oversight can compromise timely intervention, undermining the prognosis and treatment efficacy. Therefore, ensuring high precision and reproducibility in CT data acquisition with more accurate lung nodule assessment is vital to minimizing uncertainties and improving lung cancer clinical outcomes.
To determine the volume doubling time of a pulmonary nodule, only two measurements should be required. These two data points – taken at time intervals determined by clinical guidelines – are sufficient to establish a curve that characterizes the nodule’s growth pattern and enables the identification of VDT. Assuming the CT data is highly accurate, with precise nodule size measurements, the follow-up timeframe could potentially be shortened further, allowing for earlier diagnostic triaging without compromising the effectiveness of the lung cancer workup.
Methods
Multiple factors can impact the consistency of CT scanner accuracy and contribute to variability in data acquired between initial and follow-up scans. Examples include changes in scanning protocols and reconstruction kernels, servicing of equipment and software updates, or transportation of the scanner for mobile CT installations. Additionally, a patient with an initially detected pulmonary nodule may undergo follow-up or further diagnostic workup on a different CT scanner. Furthermore, the position of the lesion within the scanner field-of-view (FOV) may also impact the measurement, due to slight degradation of spatial resolution as a function of distance to iso-center. In general, any degradation in spatial resolution causes a more pronounced partial volume effect, which inevitably contributes to inaccuracies22. Similarly, any increase in image noise may increase measurement variability and thus the uncertainty of the volume estimate. Despite this understanding, there is a notable absence of detailed experimental reports specifically evaluating the accuracy and consistency of CT data for small lesion size measurements, particularly in the context of pulmonary nodules. Unified quality assurance (QA) measures, along with standardized scanning protocols to minimize variability, are therefore imperative.
With this in mind, an experimental study was conducted to demonstrate the potential for optimizing scanning protocols through the integration of CT data quality assurance. The study aimed to: (1) develop a simple and practical QA algorithm for the upfront assessment of a CT scanner’s accuracy in measuring small lesions located eccentrically in the FOV; (2) evaluate the feasibility of modifying existing preset or recommended CT scanning protocols to enhance measurement accuracy and reduce data variability; and (3) provide evidence-based rationale underscoring the importance of quality-assured CT data in detecting small pulmonary nodules, with the ultimate goal of improving lung cancer outcomes.
To achieve these goals, a series of scanning sessions were conducted using a Revolution Apex CT scanner (GE HealthCare, Chicago, IL) equipped with the Quantix tube and Quantix generator, along with a 160 mm Gemstone detector. The CTLX1S small lung nodule calibration phantom (Accumetra, Clifton Park, NY), developed in collaboration with the Radiological Society of North America’s (RSNA) Quantitative Imaging Biomarkers Alliance (QIBA) CT Small Lung Nodule Profile Committee23, was used to assess fundamental imaging performance properties of the CT scanner as well as its volumetric accuracy. Data were collected for a range of promising protocols, all fully compliant with American College of Radiology (ACR) and Society of Thoracic Radiology (STR) guidelines24 ensuring qualification for LDCT screening protocol, and passed the RSNA/QIBA Small Lung Nodule Profile CT image quality requirements [25]. Initial selection of preferred scan protocols was grounded in standard imaging principles. When measuring the volume of a small, high-contrast object – such as a solid pulmonary nodule – the goal is to achieve the highest possible three-dimensional resolution and sampling rate, without exceeding acceptable limits for image noise or compromising other aspects of CT image quality. Once the image quality optimization process was complete, attention shifted to evaluating the volume measurement performance based on ellipsoids with known volume.
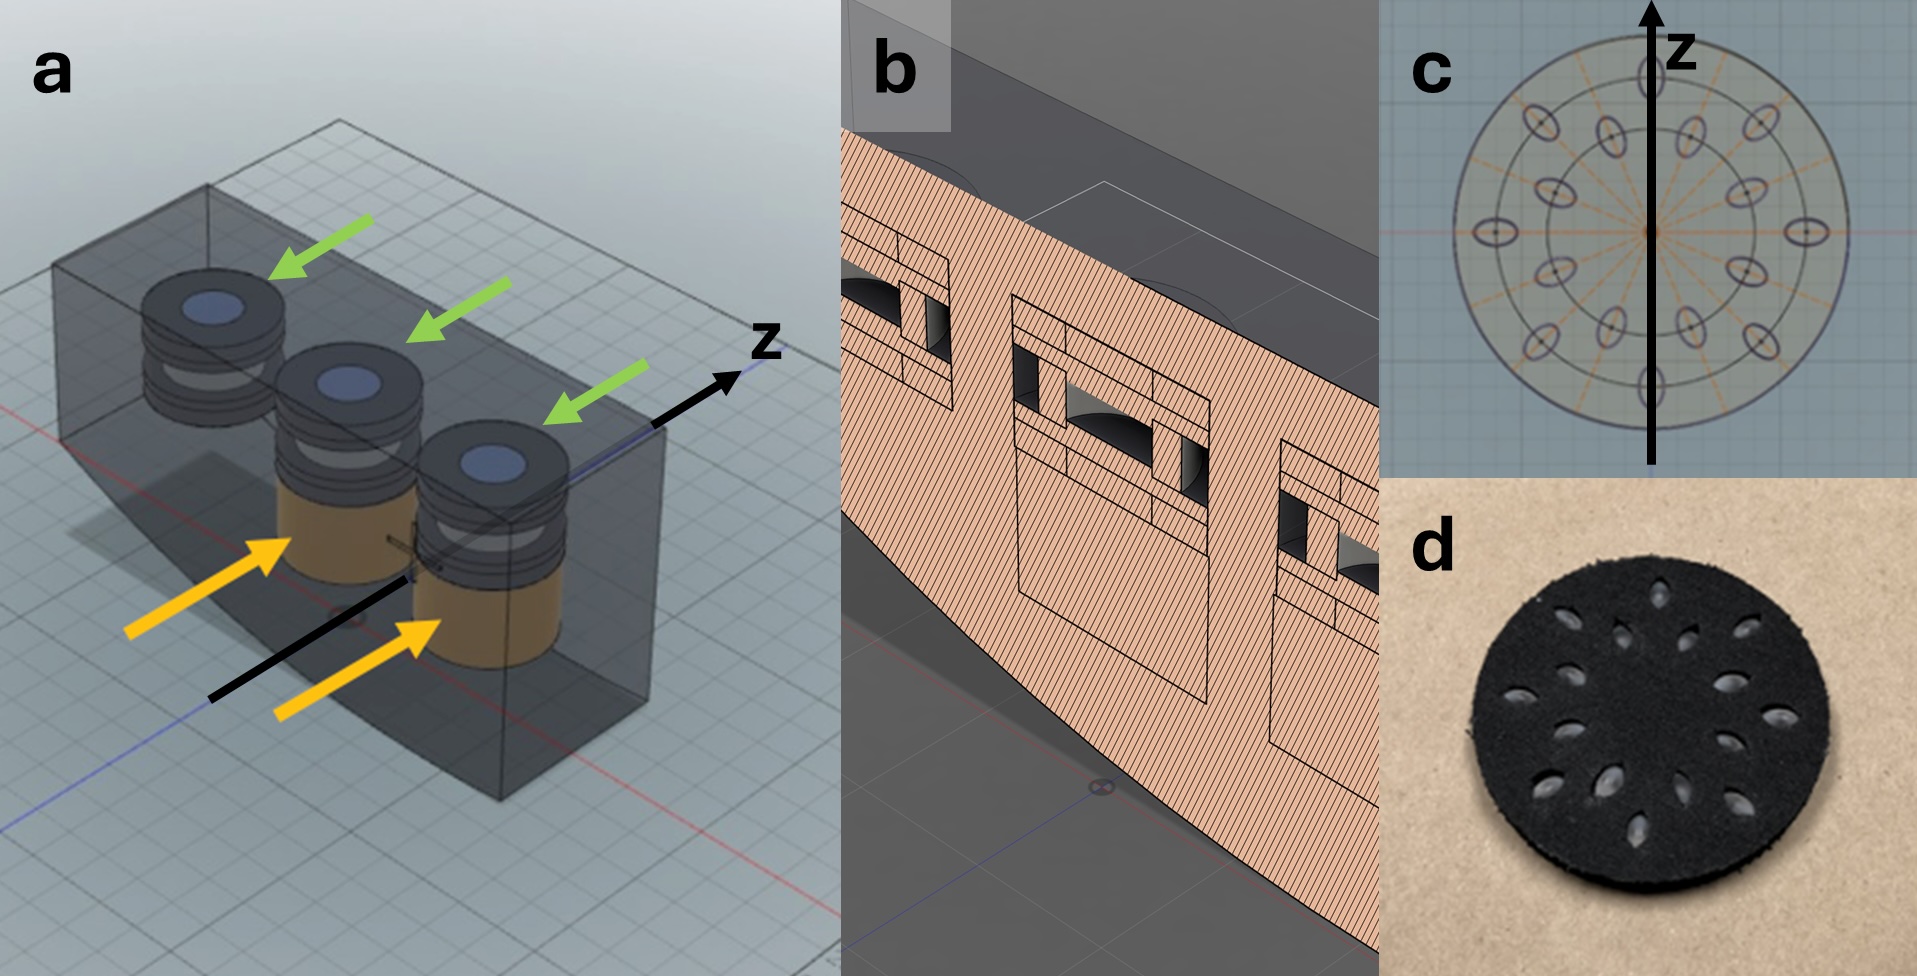
The Accumetra CTLX1S small lung nodule calibration phantom (Figure 2) consists of two sections. The first section (Fig.2a: green arrows; Fig. 2b: cross-sectional diagram) is designed to characterize fundamental imaging
performance at three distances from the isocenter: 0, 100, and 200 mm. Following the RSNA-QIBA small lung nodule profile, it includes features to evaluate the following five CT image quality requirements:
- Edge enhancement ≤ 1.05, evaluating the absence of over-/undershoots at object edges
- Point spread function volume <= 1.5mm3, defining the lowest acceptable 3D resolution
- 3D resolution aspect ratio ≤ 2.0, limiting the ratio between Z and X spatial resolution
- Image noise standard deviation ≤ 50 HU, setting a constraint on the level of image noise
- CT number bias ≤ 35 HU, setting a maximum deviation of air and acrylic HU values
- Spatial warping RMSE ≤ 0.3 mm, limiting spatial warping by measuring the root means squared error (RMSE) of an image-calculated cylindrical surface from the nominal surface
The second section (Fig.2a: yellow arrows; Fig. 2c and 2d: cross-sectional diagram and photograph) is designed to evaluate the volumetric accuracy based on five sets of acrylic ellipsoids with exactly known dimensions. Each set consists of 16 ellipsoids of identical size. In this study, only the set containing 16 ellipsoids with dimensions (6.0 mm x 3.6 mm x 3.6 mm) was used. The selection of phantom ellipsoids with a longest diameter of 6 mm in this study was guided by the clinical significance of this threshold in lung cancer screening and follow-up protocols [18], as outlined above. According to the American College of Radiology Lung-RADS guidelines [12], the decision between a 6-month and a 12-month follow-up for solid and part-solid pulmonary nodules depends on whether the nodule measures less than, or greater than or equal to, 6 mm in diameter. Therefore, the ability to access scanners’ ability to precisely and reproducibly measure nodules around this size is critically important. For the purpose of this study, the set of ellipsoids were positioned eccentrically (approximately 70mm from iso-center) to stress-test the volumetric accuracy of the CT scanner.
Three CT scan protocols were defined and comparatively evaluated in this study (Table 1). CT scanning parameter requirements from the RSNA/QIBA Small Lung Nodule Profile were used to define the “STANDARD” baseline protocol. The GE HealthCare CT scanner’s preset parameters for pulmonary assessment served as an additional reference, designated the “DEFAULT” protocol. Extensive sets of CT scans were performed to determine optimized image acquisition parameters for small lung nodule size assessment, resulting in the creation of the “OPTIMIZED” protocol. All three scanning protocols—STANDARD, DEFAULT, and OPTIMIZED—were, from the outset and remained so throughout the study, fully compliant with ACR and STR guidelines, ensuring qualification for LDCT screening protocol, and passed the RSNA/QIBA Small Lung Nodule Profile CT image quality requirements25. This includes the requirement for the estimated radiation dose for the CT scan to remain below 3 mGy. A slice spacing of 1.0 mm or greater was required to avoid generating more CT slices than typically acceptable for routine radiological review. The OPTIMIZED protocol was defined based on optimizing 3D resolution throughout the scanner FOV for lowest volume of the 3D point spread function. Based on this strategy, scan technique (kVp, mA, and helical pitch) was identical for all three protocols. The main distinguishing characteristics of the OPTIMIZED protocol from the STANDARD and DEFAULT protocols were the use of the higher resolution “BONE” reconstruction kernel and the use of a CT slice spacing of 1.00. While this spacing results in more acquired slices, the number of extra slices is considered acceptable in radiology workflows and the quantitative nodule measurement results were found to be significantly better.
| Protocol | Kernel | Thickness (mm) | Spacing (mm) | Tube current (mA) | Tube voltage (kVp) | Rotation time (s) | Helical pitch | CTDI (mGy) |
| Standard | Standard | 1.25 | 1.25 | 100 | 100 | 0.5 | 0.984 | 2.15 |
| Default | Bone | 1.25 | 1.25 | 100 | 100 | 0.5 | 0.984 | 2.15 |
| Optimized | Bone | 1.25 | 1.00 | 100 | 100 | 0.5 | 0.984 | 2.15 |
Table 1: Summary of the three selected CT scan protocols evaluated in this study, including scan and reconstruction parameters, with key parameter differences highlighted in bold/underline.
Volume measurements were performed for each 6.0 x 3.6 x 3.6 mm acrylic ellipsoid (the smallest of all), using the open-source Lesion Sizing Toolkit (Accumetra, Clifton Park, NY) [1, 2]. For each ellipsoid, the mean volume and standard deviation were calculated across all 16 measurements. Based on the known manufactured volume of 40.5 mm³, the volumetric measurement bias was calculated as the difference between the mean measured volume and the ground truth. Additionally, the volumetric measurement coefficient of variation (COV) was computed as the ratio of the standard deviation to the mean measured volume. An optimized CT image acquisition protocol is expected to demonstrate both lower volumetric measurement bias and lower COV when compared to a reference protocol, indicating improved accuracy and precision in small nodule volumetry. Given the significant impact of the volume measurement tool on volumetric accuracy, a second, AI-based volume measurement tool was also utilized. The aim of this study is not to perform an in-depth comparison of different volume measurement tools but rather to confirm that the same trends persist across different scan protocols.
Results and discussion
Fundamental imaging performance properties for all three protocols are summarized in Table 2. All three protocols met the requirements set by the RSNA-QIBA small lung nodule profile. The DEFAULT GE HealthCare protocol offered improved resolution compared to the STANDARD RSNA/QIBA protocol.
| Criterion | Required | STANDARD | DEFAULT | OPTIMIZED |
| Voxel Size (mm^3) | n/a | 0.688 | 0.688 | 0.551 |
| 3D Resolution (mm^3) | ≤ 1.50 | 0.646 | 0.278 | 0.245 |
| Edge Enhancement | ≤ 1.05 | 0.942 | 0.940 | 0.958 |
| Resolution Aspect | ≤ 2.0 | 1.183 | 1.951 | 1.736 |
| Bias Air (HU) | [-35; 35] | 2.45 | 5.6 | 2.83 |
| Bias Acrylic (HU) | [-35; 35] | -18.28 | -17.10 | -14.05 |
| Image Noise Air SD (HU) | ≤ 50 | 6.29 | 17.94 | 18.75 |
| Image Noise Acrylic SD (HU) | ≤ 50 | 5.81 | 18.10 | 21.47 |
| Spatial Warping RMSE (mm) | ≤ 0.3 | 0.072 | 0.067 | 0.046 |
Table 2: Fundamental imaging performance properties were evaluated for the three studied CT scan protocols and confirmed to meet the requirements set by the RSNA-QIBA small lung nodule profile. Key differences in performance are in bold/underline.
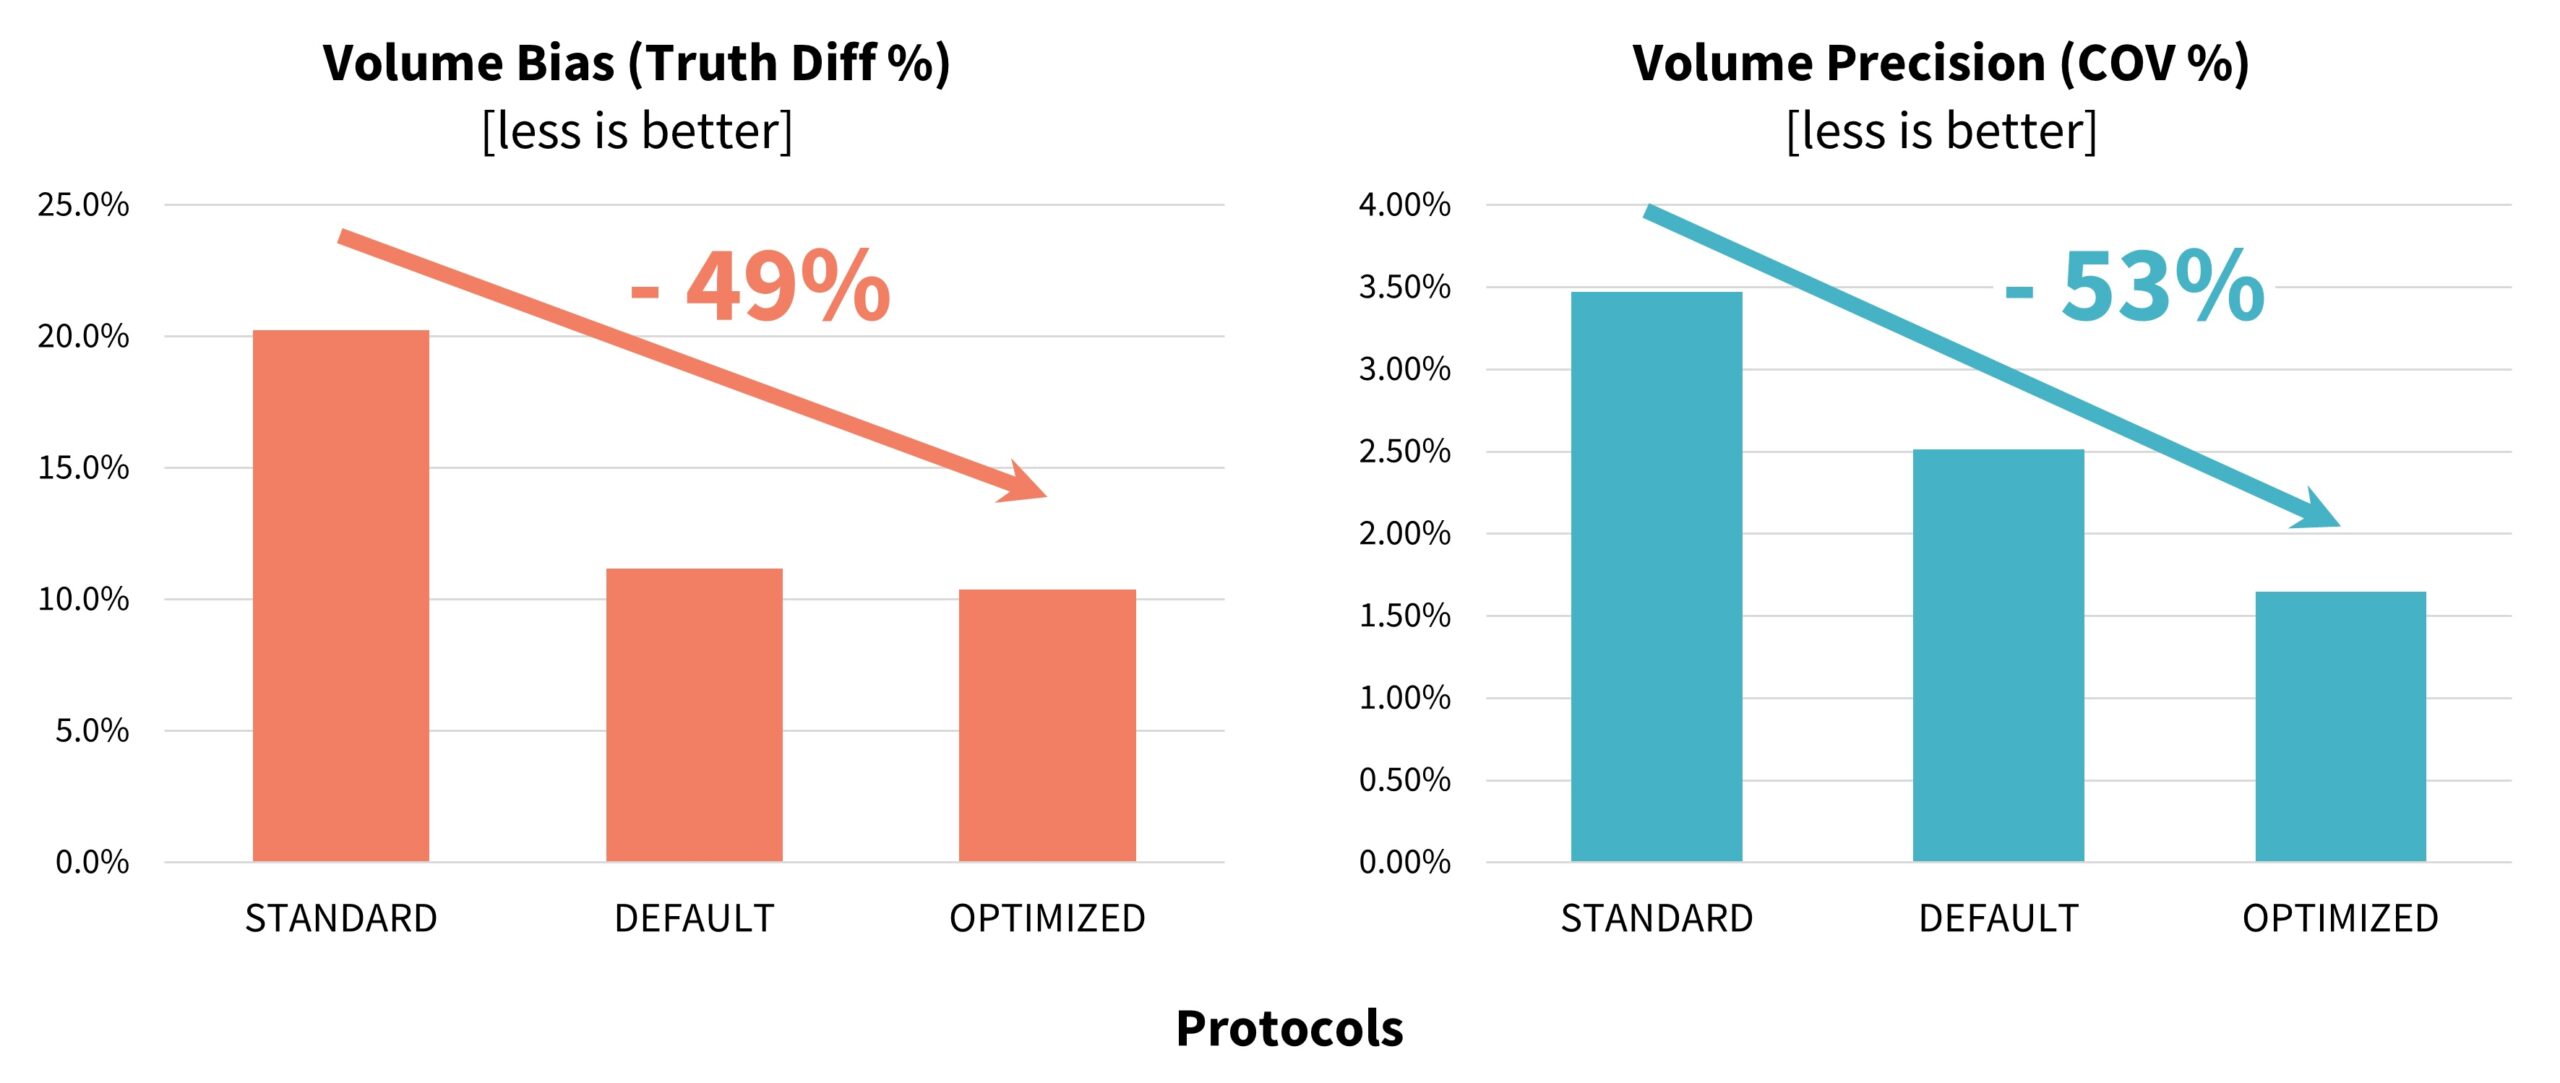
In terms of volumetric accuracy, the results of the experiment demonstrated a substantial improvement in volumetric measurement performance with the use of the OPTIMIZED protocol defined and validated in this study. Specifically, the OPTIMIZED protocol reduced volumetric measurement bias by 49%, decreasing from 20.3% with the STANDARD protocol to 10.4%. In parallel, volumetric precision, as measured by the coefficient of variation, improved by 52%, with the COV decreasing from 3.48% under the STANDARD protocol to 1.65% under the OPTIMIZED protocol
(Figure 3).These findings highlight the effectiveness of targeted protocol optimization in enhancing both the accuracy and reproducibility of small nodule volume measurements – an essential factor for reliable lung cancer screening and longitudinal follow-up. The volume accuracy as measured using the FDA-approved AI tool were similar to the results from the Accumetra tool: the DEFAULT protocol outperformed the STANDARD protocol, and the OPTIMIZED protocol had the best performance.
Our study demonstrates that the capabilities of the CT scanner, including resolution, calibration, and consistency in image generation, play a pivotal role in providing reproducible and accurate data for volumetric and size measurements. Without stringent quality assurance protocols, errors in measurement could compromise the ability to detect malignancy at its earliest and most treatable stages. This underscores the importance of maintaining high standards in CT imaging, encompassing both the technical performance of the scanner and adherence to optimized imaging protocols, to support the precise and early diagnosis of lung cancer.
Ensuring high accuracy and reproducibility in lesion sizing is essential to support consistent volumetric analysis and to guide evidence-based clinical decisions in lung cancer care. Greater accuracy in the assessment of small pulmonary nodules significantly enhances the clinical value of CT imaging in the early detection of lung cancer. Precise and reproducible measurements – particularly for nodules near clinically relevant size thresholds – support more confident decision-making regarding follow-up intervals, risk stratification, and intervention planning. This study demonstrates that CT imaging protocols can be optimized not only to improve overall image quality, but also to reduce measurement bias and variability, even for nodules located away from the scanner’s isocenter.
These findings underscore somewhat untapped potential of CT systems to deliver more accurate evaluations of small, off-isocentric nodules, thereby strengthening the reliability of lung cancer screening programs and contributing to better patient outcomes through earlier and more informed clinical decisions.
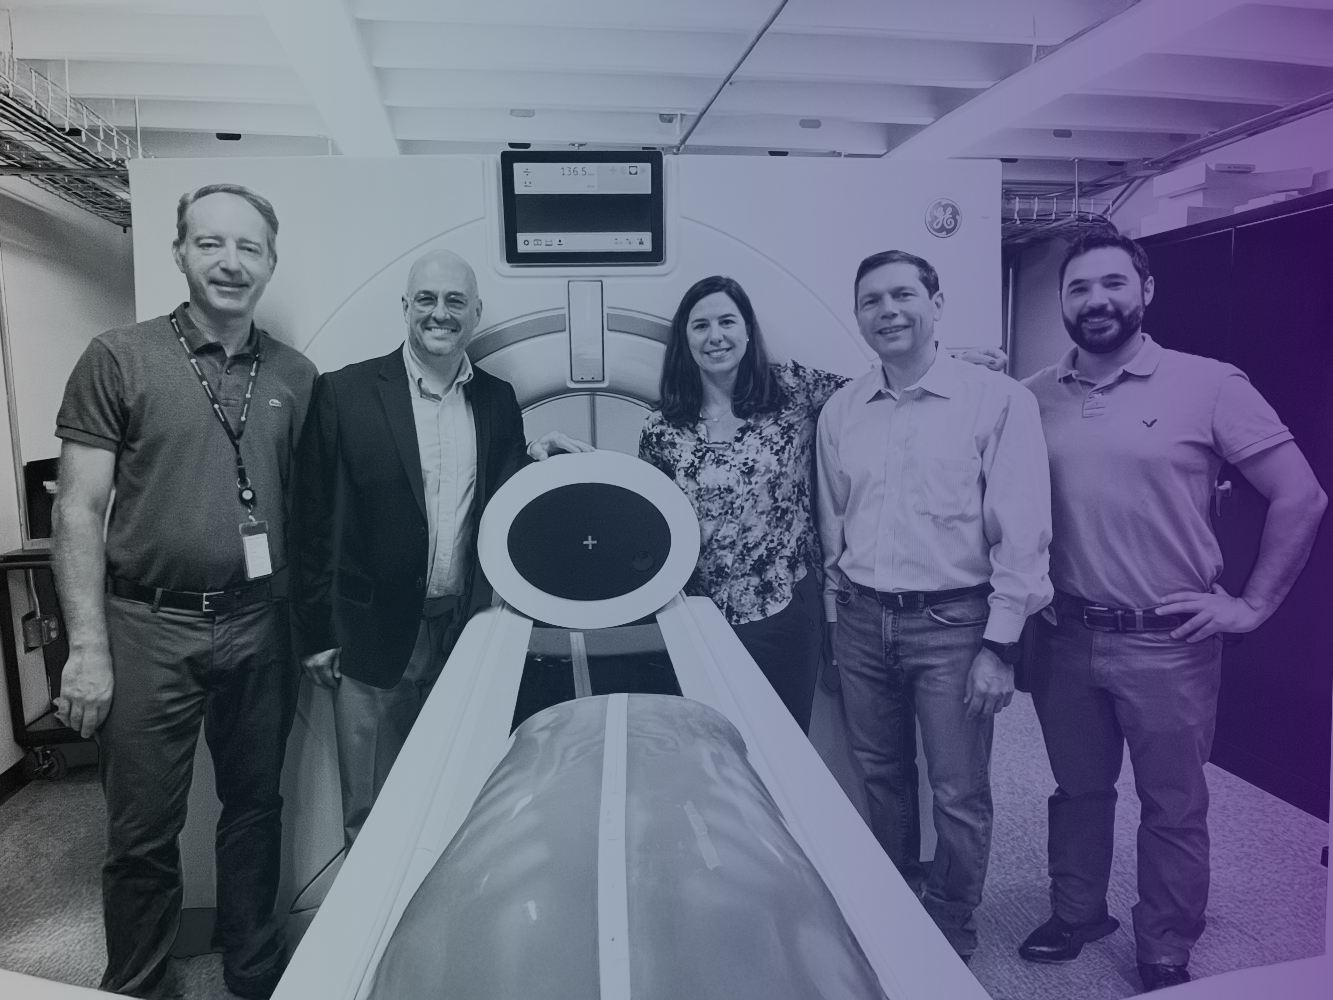
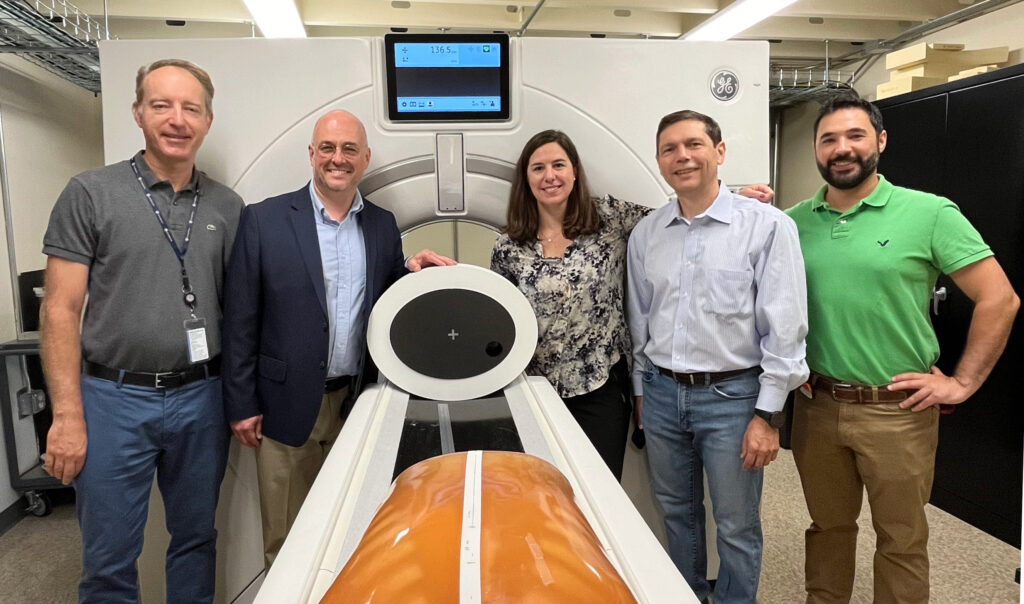
Figure 4 shows a picture of the study team with the Revolution Apex CT scanner and the CTLX1S phantom. The study team gratefully acknowledges Prof. Claudia Henschke for her valuable guidance and contributions to the experiment, provided remotely during its execution.
Future outlook
CT technology is continuously advancing, in terms of spatial resolution, image noise, and dose-efficiency. In particular, the emergence of photon-counting CT26 will undoubtedly offer a significant step forward in spatial resolution and in contrast-to-noise ratio. For the foreseeable future, this cutting-edge technology will be primarily adopted at leading academic hospitals. However, advances in spatial resolution and noise reduction are also expected in traditional CT scanners based on energy-integrating detectors, through the introduction of deep learning image reconstruction techniques for super-resolution27, and noise reduction28. These improvements are expected to enhance fundamental imaging performance and, consequently, volume measurement accuracy. Nevertheless, even with those advanced technologies, quality assurance and protocol optimization will remain critical steps to ensure reproducible, precise volumetry and clinical decision-making.
In addition, the field of radiomics data analytics is undergoing significant advancements, particularly with the integration of deep-learning algorithms for mining CT data. These developments are driving a potential shift from traditional metrics such as volume doubling time to more sophisticated imaging biomarkers that could potentially eliminate the need for follow-up imaging altogether29. Advanced algorithms can extract high-dimensional features from CT scans, enabling the assessment of nodules’ malignancy risk based on their texture, shape, and density profiles, often at a single time point. However, the accuracy of the input data remains critical, as even the most powerful models rely on precise and consistent CT measurements30. Without accurate baseline imaging, the reliability and utility of these emerging biomarkers may be compromised, underscoring the critical importance of data quality in advancing lung cancer diagnostics and therapy decision-making.
- American Cancer Society, Lung Cancer Survival Rates. 2024 [cited 2025; Available from: https://www.cancer.org/cancer/types/lung-cancer/detection-diagnosis-staging/survival-rates.html ↩︎
- Yotsukura, M., et al., Long-Term Prognosis and Prognostic Indicators of Stage IA Lung Adenocarcinoma. Ann Surg Oncol, 2023. 30(2): p. 851-858. ↩︎
- Henschke, C.I., et al., A 20-year Follow-up of the International Early Lung Cancer Action Program (I-ELCAP). Radiology, 2023. 309(2): p. e231988. ↩︎
- Henschke, C.I., et al., Radiographic screening for cancer. Proposed paradigm for requisite research. Clin Imaging, 1994. 18(1): p. 16-20. ↩︎
- Fornell, D. Q&A: What updated reimbursement policies could mean for CT lung screening rates in the United States. 2022. ↩︎
- Fischbach, F., et al., Detection of pulmonary nodules by multislice computed tomography: improved detection rate with reduced slice thickness. Eur Radiol, 2003. 13(10): p. 2378-83. ↩︎
- Ocana-Tienda, B., et al., Growth dynamics of lung nodules: implications for classification in lung cancer screening.Cancer Imaging, 2024. 24(1): p. 113. ↩︎
- Callister MEJ, e.a., British Thoracic Society Guidelines for the Investigation and Management of Pulmonary Nodules Thorax: An International Journal of Respiratory Medicine, 2015. 70. ↩︎
- Oudkerk, M., et al., European position statement on lung cancer screening. Lancet Oncol, 2017. 18(12): p. e754-e766.
↩︎ - Lung cancer screening in Japan. 2023 [cited 2025 6 June]; Available from: https://www.lungcancerpolicynetwork.com/three-decades-of-ldct-screening-in-japan/ ↩︎
- MacMahon, H., et al., Guidelines for Management of Incidental Pulmonary Nodules Detected on CT Images: From the Fleischner Society 2017. Radiology, 2017. 284(1): p. 228-243. ↩︎
- American College of Radiology Committee on Lung-RADS®. Lung-RADS Assessment Categories 2022. Available at https://www.acr.org/-/media/ACR/Files/RADS/Lung-RADS/Lung-RADS-2022.pdf. Accessed on January 1, 2023. 2022. ↩︎
- National Comprehensive Cancer Network: NCCN Guidelines – Non-Small Cell Lung Cancer. 2025; Available from: https://www.nccn.org/guidelines/guidelines-detail?category=1&id=1450 ↩︎
- Canadian Association of Radiologists: Guide on CT Screening for Lung Cancer. 2016. ↩︎
- Health Commission Of The People’s Republic Of China, N., National guidelines for diagnosis and treatment of lung cancer 2022 in China (English version). Chin J Cancer Res, 2022. 34(3): p. 176-206. ↩︎
- Goldwasser, D.L., Estimation of the tumor size at cure threshold among aggressive non-small cell lung cancers (NSCLCs): evidence from the surveillance, epidemiology, and end results (SEER) program and the national lung screening trial (NLST). Int J Cancer, 2017. 140(6): p. 1280-1292. ↩︎
- Naidich, D.P., et al., Variables affecting pulmonary nodule detection with computed tomography: evaluation with three-dimensional computer simulation. J Thorac Imaging, 1993. 8(4): p. 291-9. ↩︎
- Yankelevitz, D.F., R. Yip, and C.I. Henschke, Impact of Duration of Diagnostic Workup on Prognosis for Early Lung Cancer. J Thorac Oncol, 2023. 18(4): p. 527-537. ↩︎
- Creamer A, e.a., Growth patterns of screen-detected malignant pulmonary nodules: Accuracy of doubling-time models. .European Respiratory Journal 2023. 62. ↩︎
- Yankelevitz, D.F., et al., Overdiagnosis in chest radiographic screening for lung carcinoma: frequency. Cancer, 2003. 97(5): p. 1271-5. ↩︎
- Jiang, B., et al., Lung cancer volume doubling time by computed tomography: A systematic review and meta-analysis.Eur J Cancer, 2024. 212: p. 114339. ↩︎
- Fakhar, H.B., et al., Effect of Voxel Size and Object Location in the Field of View on Detection of Bone Defects in Cone Beam Computed Tomography. J Dent (Tehran), 2016. 13(4): p. 279-286. ↩︎
- Mulshine, J.L., et al., Role of the Quantitative Imaging Biomarker Alliance in optimizing CT for the evaluation of lung cancer screen-detected nodules. J Am Coll Radiol, 2015. 12(4): p. 390-5. ↩︎
- Kazerooni, E.A., et al., ACR-STR practice parameter for the performance and reporting of lung cancer screening thoracic computed tomography (CT): 2014 (Resolution 4). J Thorac Imaging, 2014. 29(5): p. 310-6. ↩︎
- QIBA Profile: Small Lung Nodule Volume Assessment and Monitoring in Low Dose CT Screening. 2018. ↩︎
- Willemink, M.J., et al., Photon-counting CT: Technical Principles and Clinical Prospects. Radiology, 2018. 289(2): p. 293-312. ↩︎
- Qiu, D., Y. Cheng, and X. Wang, Medical image super-resolution reconstruction algorithms based on deep learning: A survey. Comput Methods Programs Biomed, 2023. 238: p. 107590. ↩︎
- Ichikawa, Y., et al., Deep learning image reconstruction for improvement of image quality of abdominal computed tomography: comparison with hybrid iterative reconstruction. Jpn J Radiol, 2021. 39(6): p. 598-604. ↩︎
- Chetan, M.R., et al., Developing an understanding of artificial intelligence lung nodule risk prediction using insights from the Brock model. Eur Radiol, 2022. 32(8): p. 5330-5338. ↩︎
- Mahmood, U., et al., Quality control of radiomic features using 3D-printed CT phantoms. J Med Imaging (Bellingham), 2021. 8(3): p. 033505. ↩︎